The State of Black-capped Chickadees in the Northeast United States
Increasing
Population has overall increased by 26% since 2010
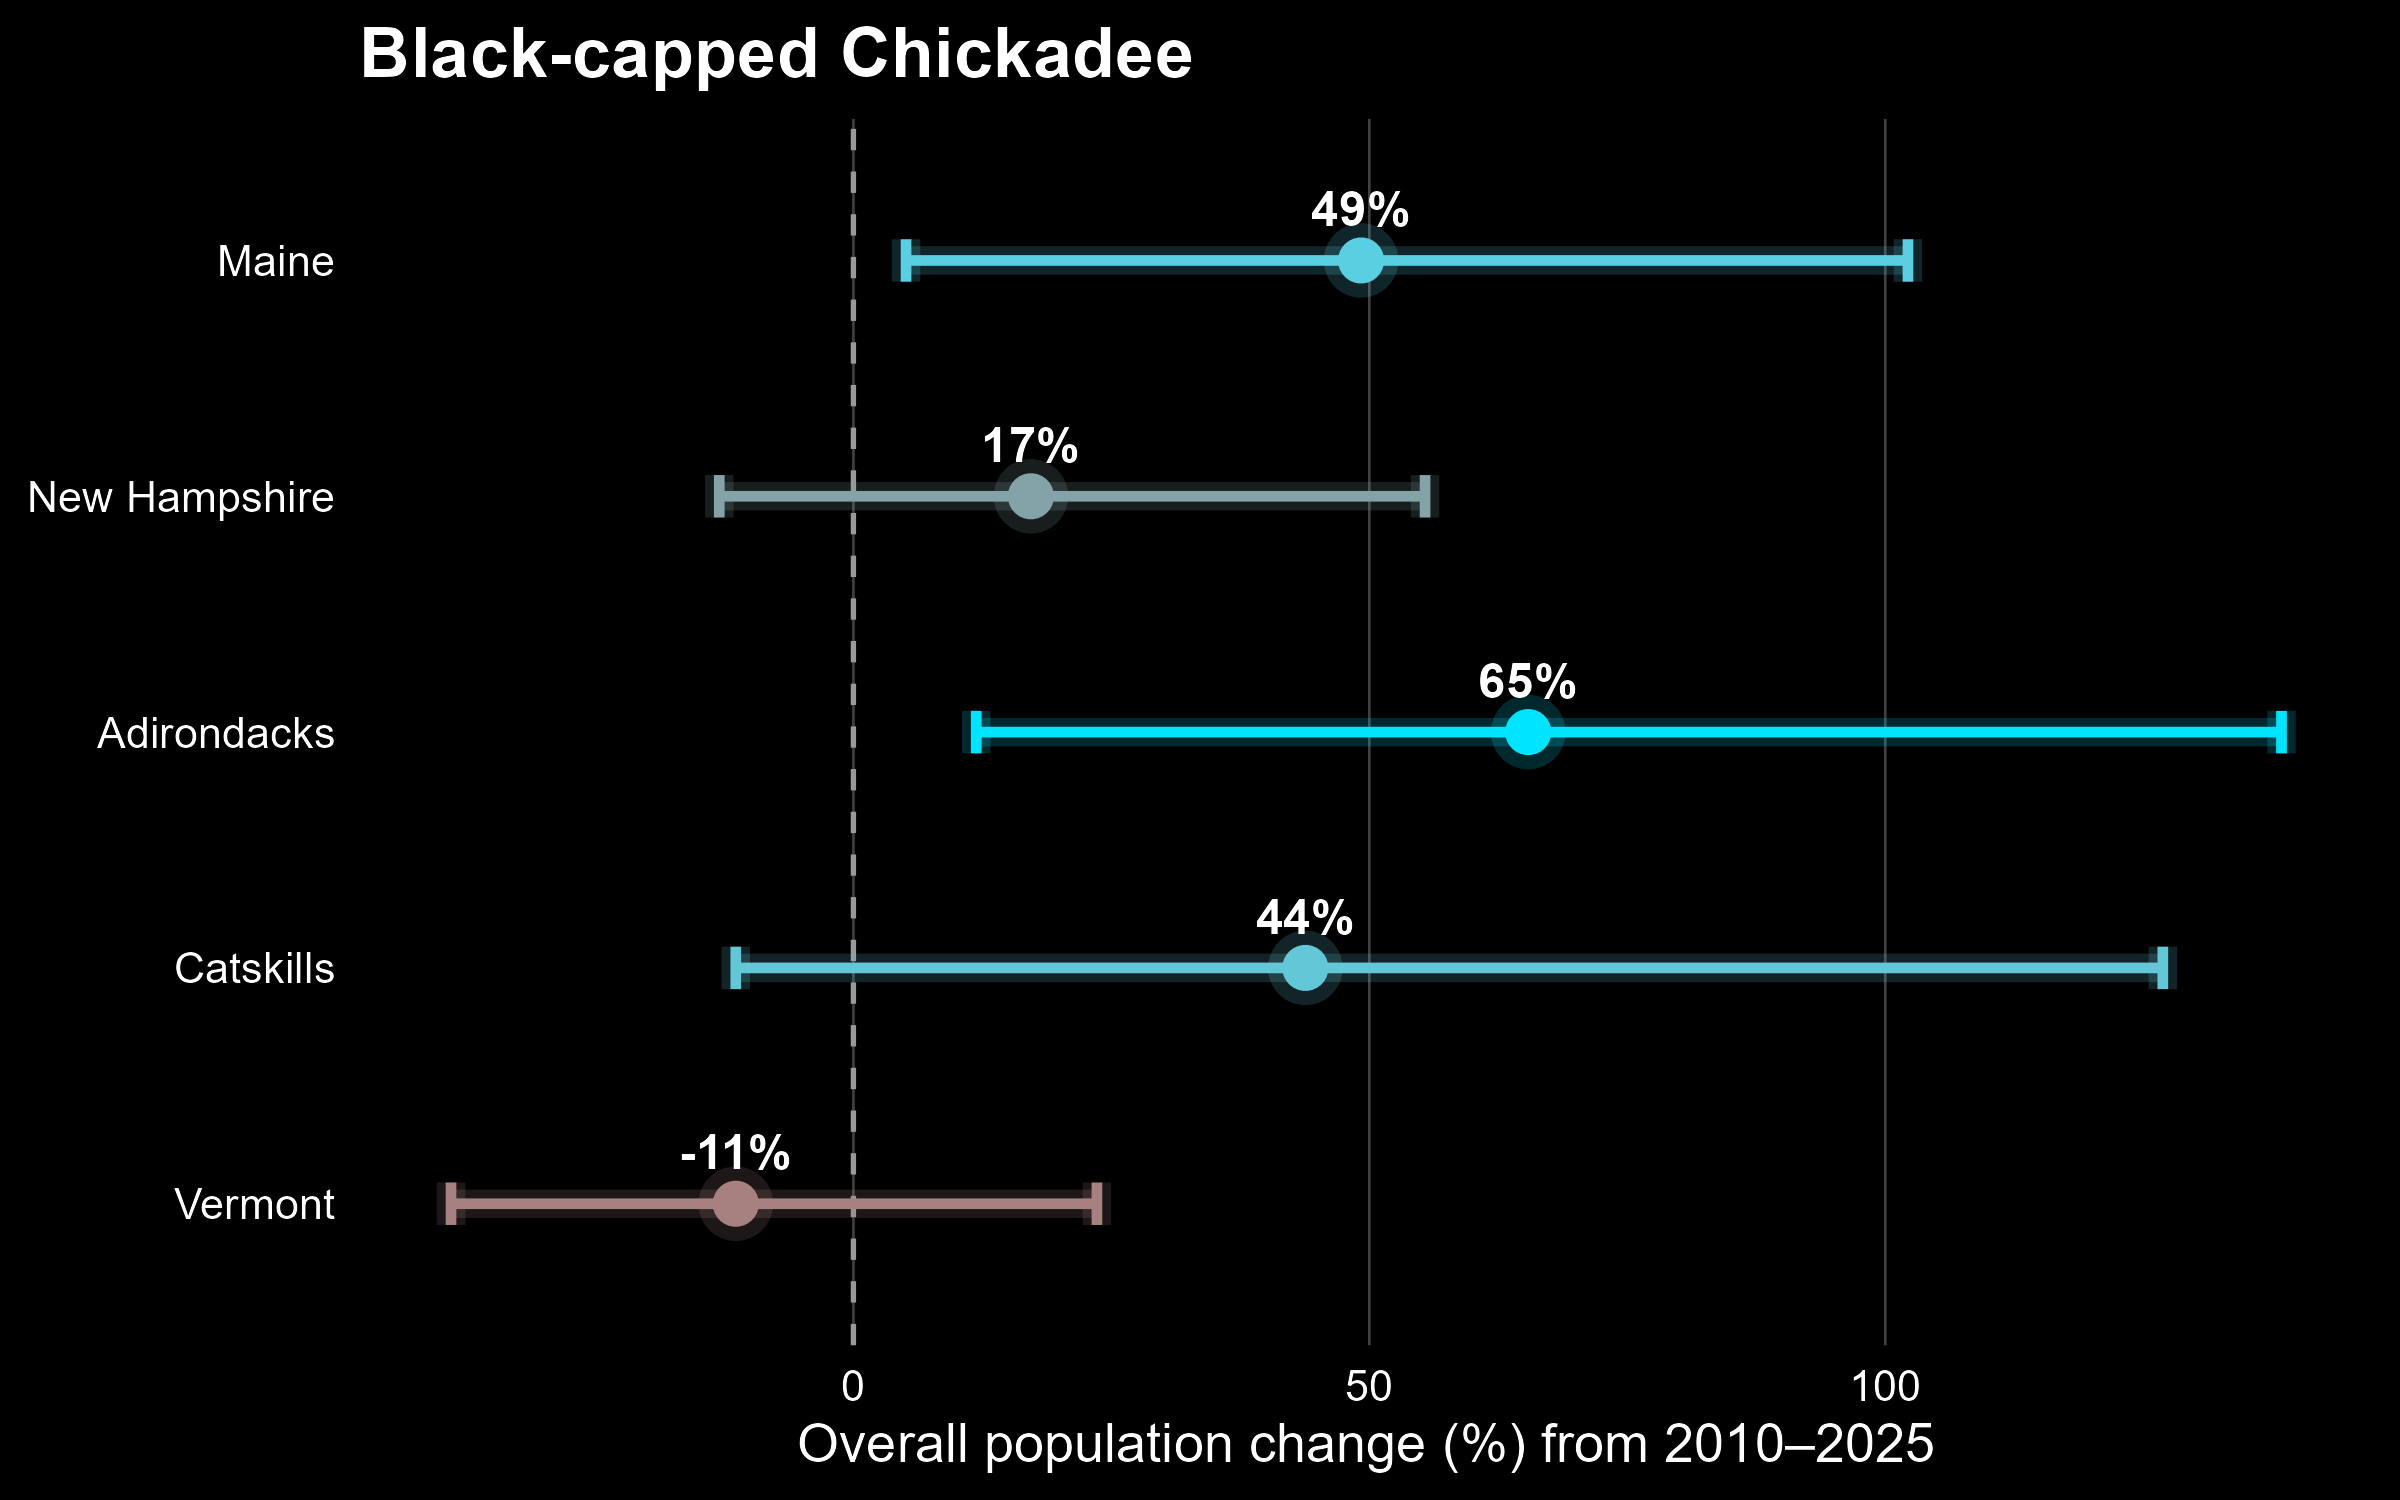
Black-capped Chickadee population changes, with 95% credible intervals, as based on Mountain Birdwatch monitoring data within each region from 2010-2025.
 Most of us probably don’t think of Black-capped Chickadees as a montane species, but this species readily adapts to human-modified landscapes–including mountain summits if there’s human presence. For example, this species can be found in sufficient quantities within the spruce-fir forest around the upper parking lots near the summits of Mt. Mansfield and Mt. Washington, but are not know to breed on lower, less-modified peaks such as Carter Dome and Mt. Carrigain. Mountain Birdwatch data suggest that Black-capped Chickadee numbers have increased at an annual rate of 1.55% in the spruce-fir mountain zone of the northeastern United States since 2010. Black-capped Chickadees were not counted during the first iteration of Mountain Birdwatch (from 2000-2009), so whether recent increases reflect a long-term trend is unclear. However, in 2010 Black-capped Chickadees were absent from the six initial Mountain Birdwatch routes in the Catskills. Our models estimate that there are now likely >20 Black-capped Chickadees around the sampling stations along these six routes in 2025, despite no obvious changes to the forest composition. While this growth is impressive, there are two points to keep in mind. 1) Black-capped Chickadees are still very rare in the spruce-fir zone along Mountain Birdwatch routes, so their trends are disproportionately affected by the addition or subtraction of a few individuals each year. 2) Black-capped Chickadees certainly breed in the spruce-fir zone at low densities, but the figure above suggests that Black-capped Chickadees may be erratic into this forest biome in some years. Boreal Chickadees, for example, are also known to be erratic from year-to-year: they may be locally common one year, and entirely absent the next–perhaps related to local food availability and abundance.
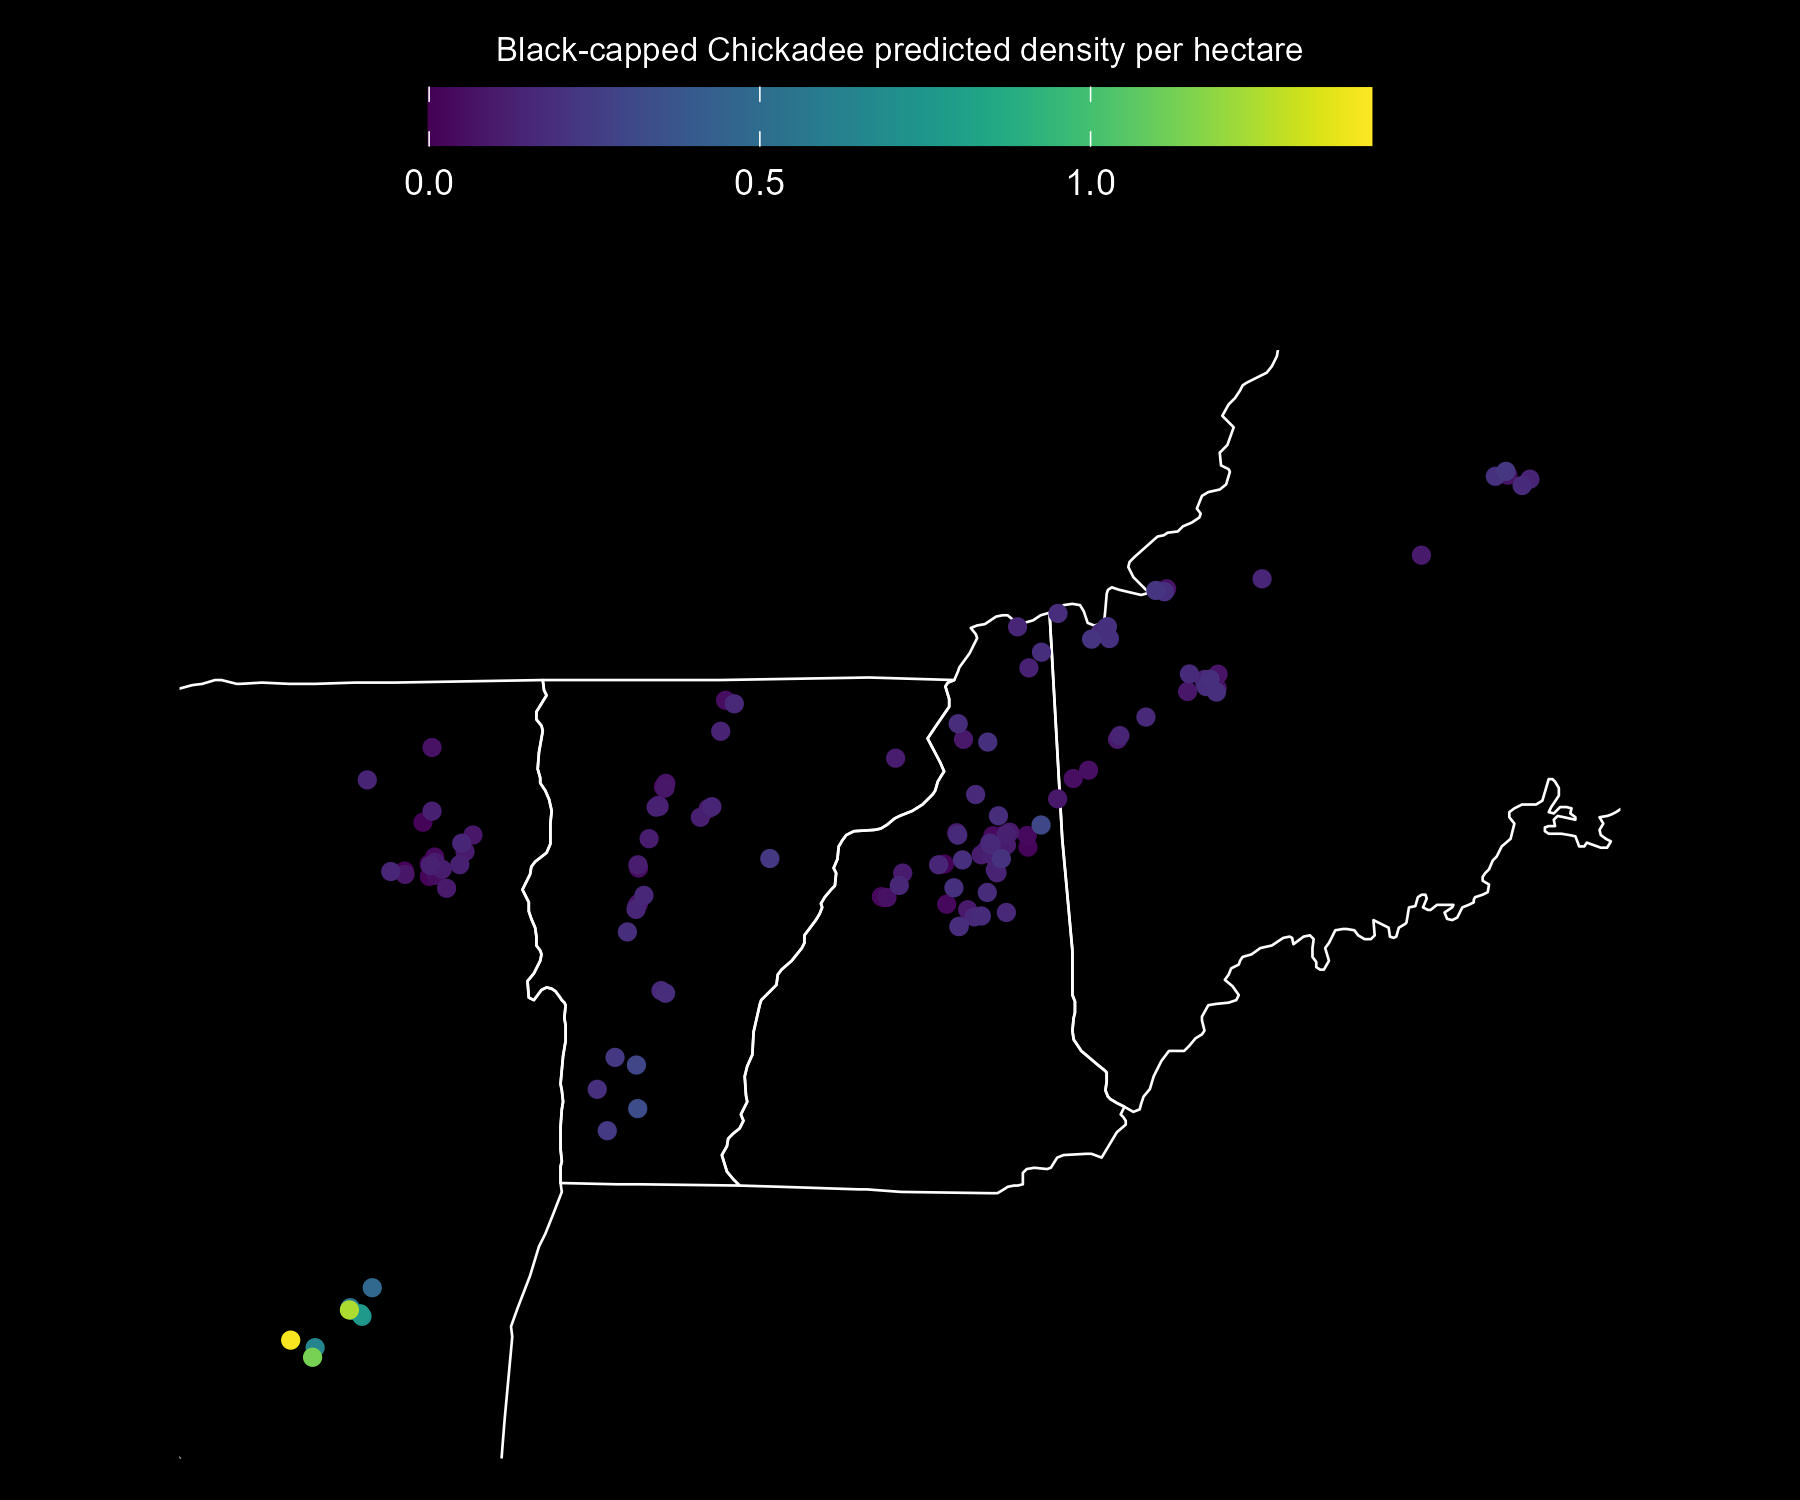
Predicted Black-capped Chickadee adult density per approximate hectare, as estimated from Mountain Birdwatch data. The base map shows the extent of the Mountain Birdwatch region: eastern New York, Vermont, New Hampshire, and western Maine.
Population trends for Black-capped Chickadee from 2010–2025 based on Mountain Birdwatch monitoring data. Values show the estimated mean annual population change (%) and the cumulative population change (%) since 2010, each with 95% Bayesian credible intervals (CRI). Colored dots indicate the direction and strength of evidence for a trend. Strong evidence occurs when the 95% CRI does not include zero. The probability of increase (0–1) reflects the proportion of model estimates indicating a positive population change.
| Region | Annual trend (%) | Trend (95% CRI) | Probability of increase | Population change (%) 2010-2025 | Population change (95% CRI) |
|---|---|---|---|---|---|
| All regions | ●1.55 | (0.46, 2.71) | >0.99 | 26.3 | (7.1, 49.3) |
| Maine | ●2.61 | (0.33, 4.81) | 0.99 | 49.2 | (5.1, 102.2) |
| New Hampshire | ●1.00 | (-0.92, 2.98) | 0.84 | 17.2 | (-13.0, 55.4) |
| New York (Adirondacks) | ●3.29 | (0.75, 5.96) | 0.99 | 65.4 | (11.9, 138.4) |
| New York (Catskills) | ●2.27 | (-0.80, 5.61) | 0.92 | 43.8 | (-11.4, 126.9) |
| Vermont | ●-0.90 | (-3.24, 1.42) | 0.22 | -11.4 | (-39.0, 23.6) |
● strong decline
● weak decline
● weak increase
● strong increase
Globally: Uncertain
Data from the North American Breeding Bird Survey suggest that Black-capped Chickadee numbers are overall increasing across the United States and Canada (~0.6% per year). These increases, however, are largely confined to the upper Midwest and the eastern half of the species’ range. In contrast, eBird trends suggest that Black-capped Chickadee numbers have declined by as much as 20% over the last decade in the eastern U.S.