The State of Swainson’s Thrushes in the Northeast United States
Declining
Population has overall decreased by 29% since 2010
Swainson’s Thrush population changes, with 95% credible intervals, as based on Mountain Birdwatch monitoring data within each region from 2010-2025.
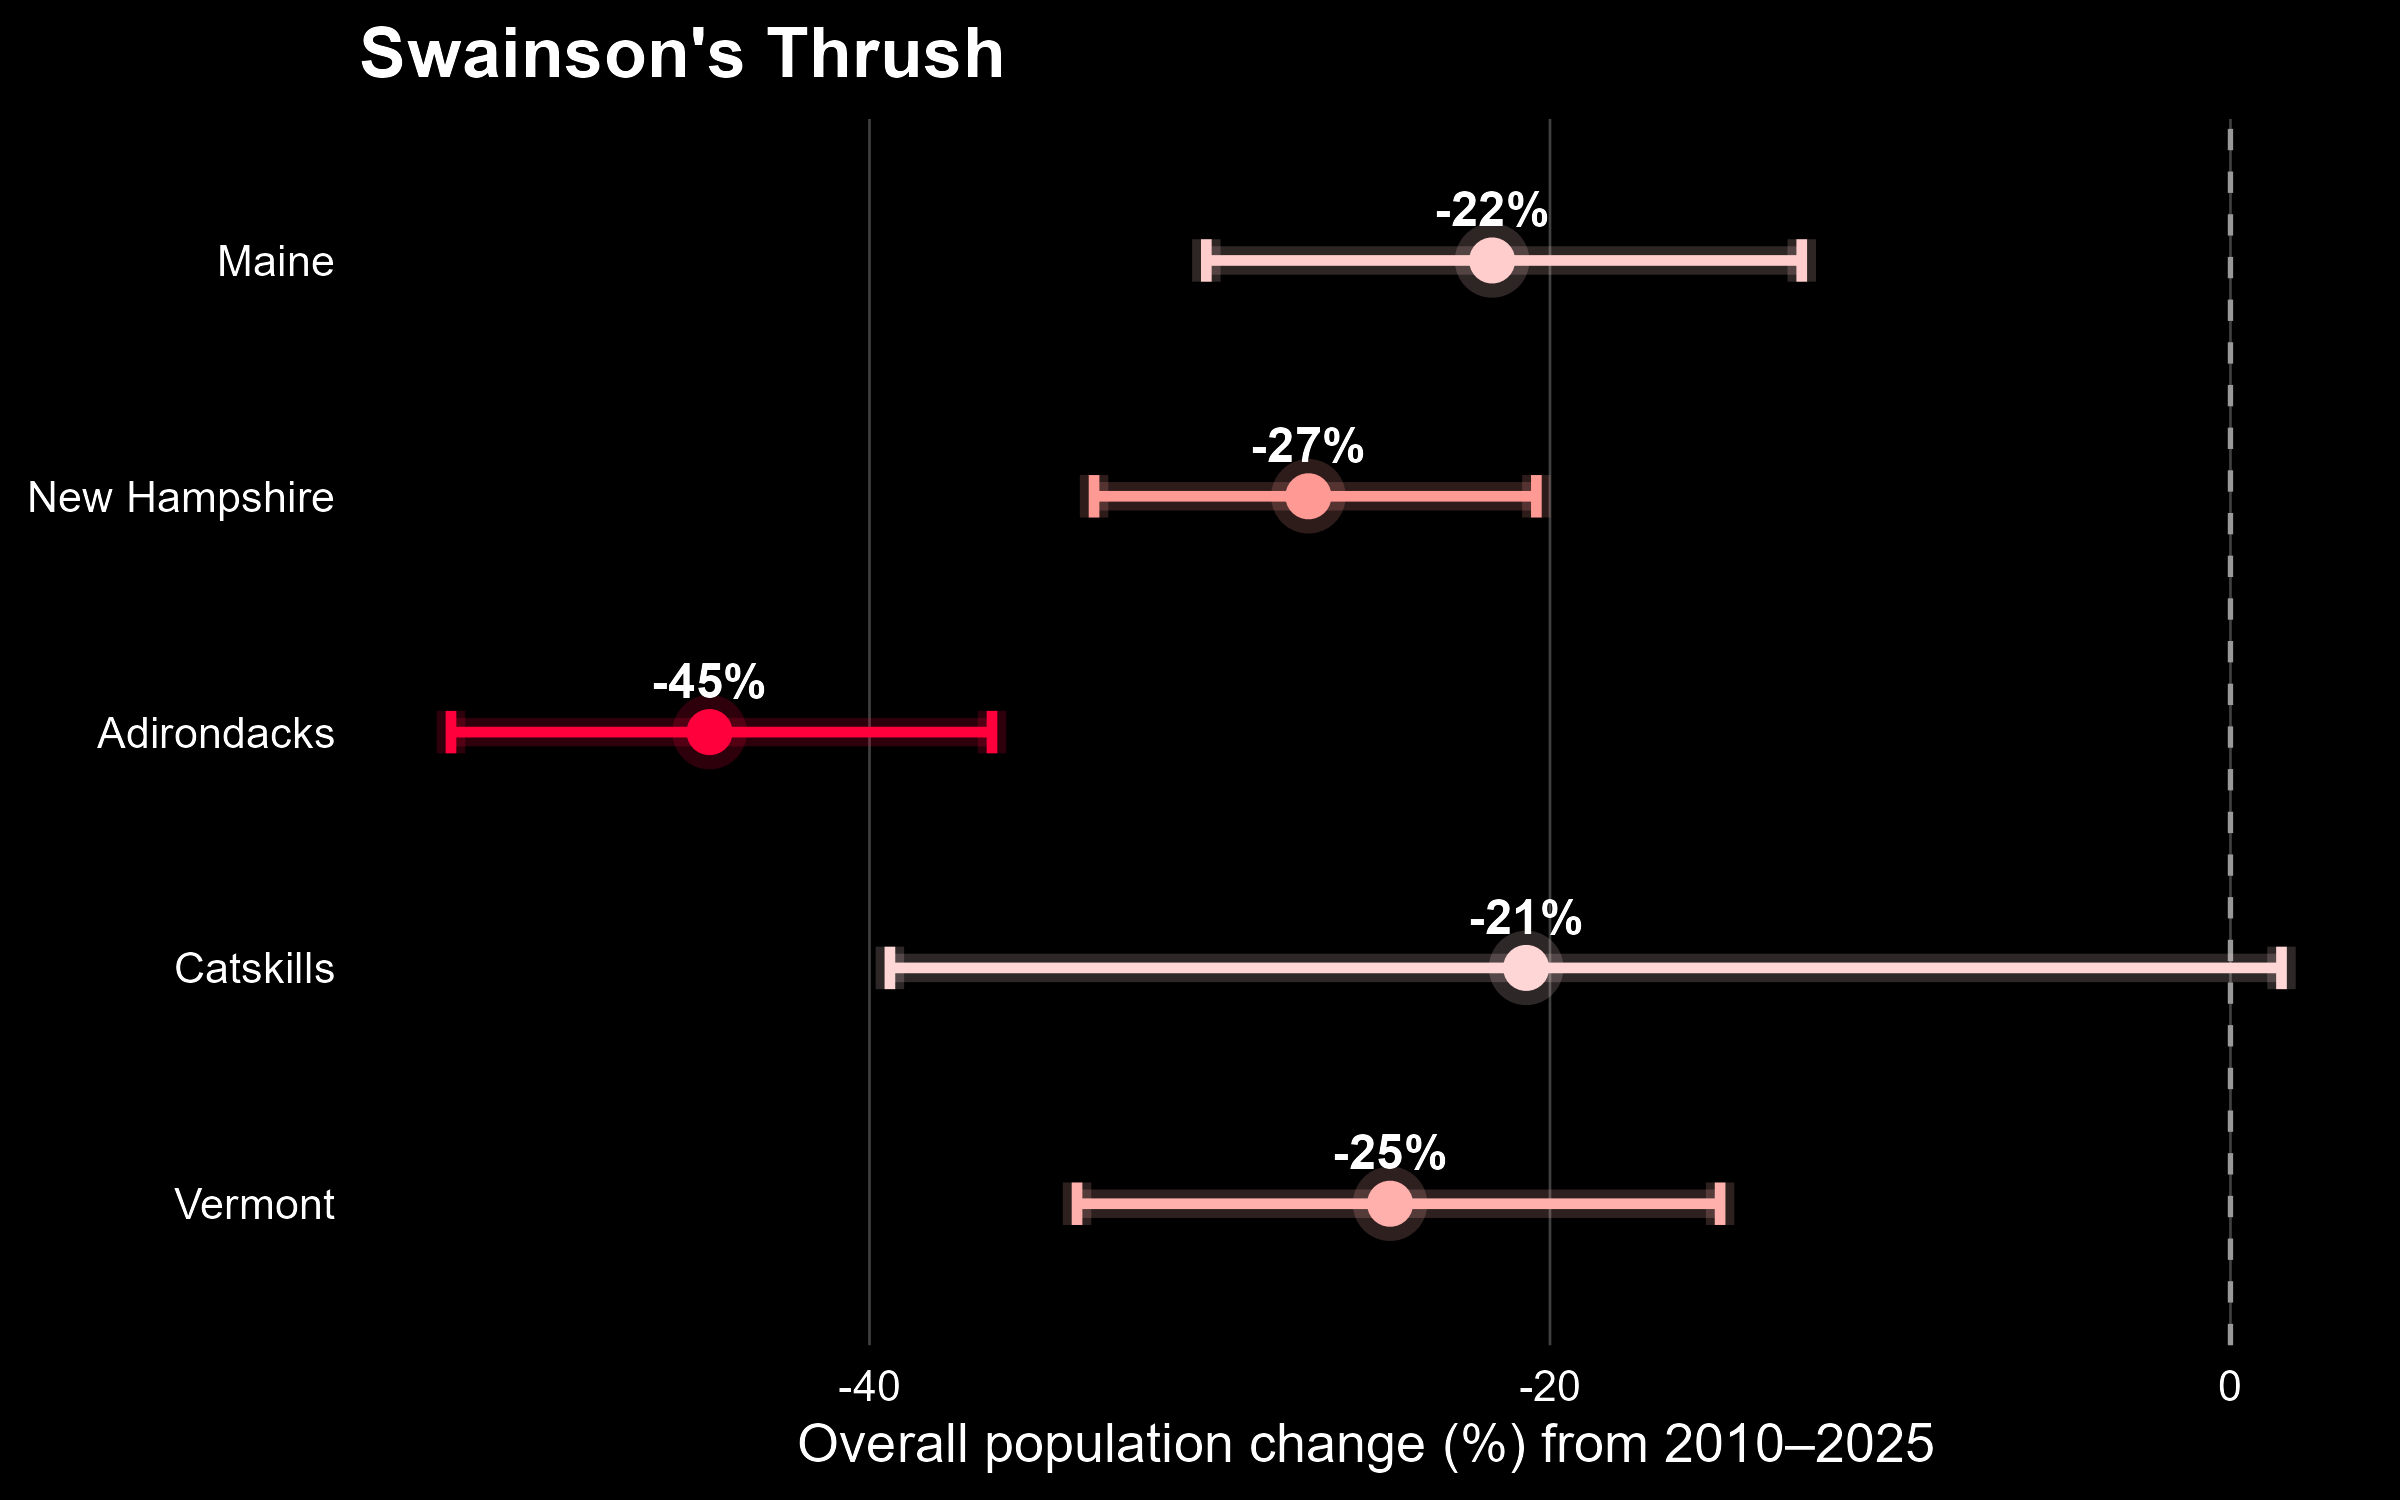 Swainson’s Thrush numbers have likely decreased since Mountain Birdwatch began. Annual fluctuations are evident, but overall counts of this species have steadily declined in the northeastern U.S. over the last half-century. Mountain Birdwatch data indicate an average decline of 2.22% per year in the mountains of our region; this trend equates to a 28.6% decline in population (95% credible interval = -32.5% to -24.4%) between 2010 and 2025.
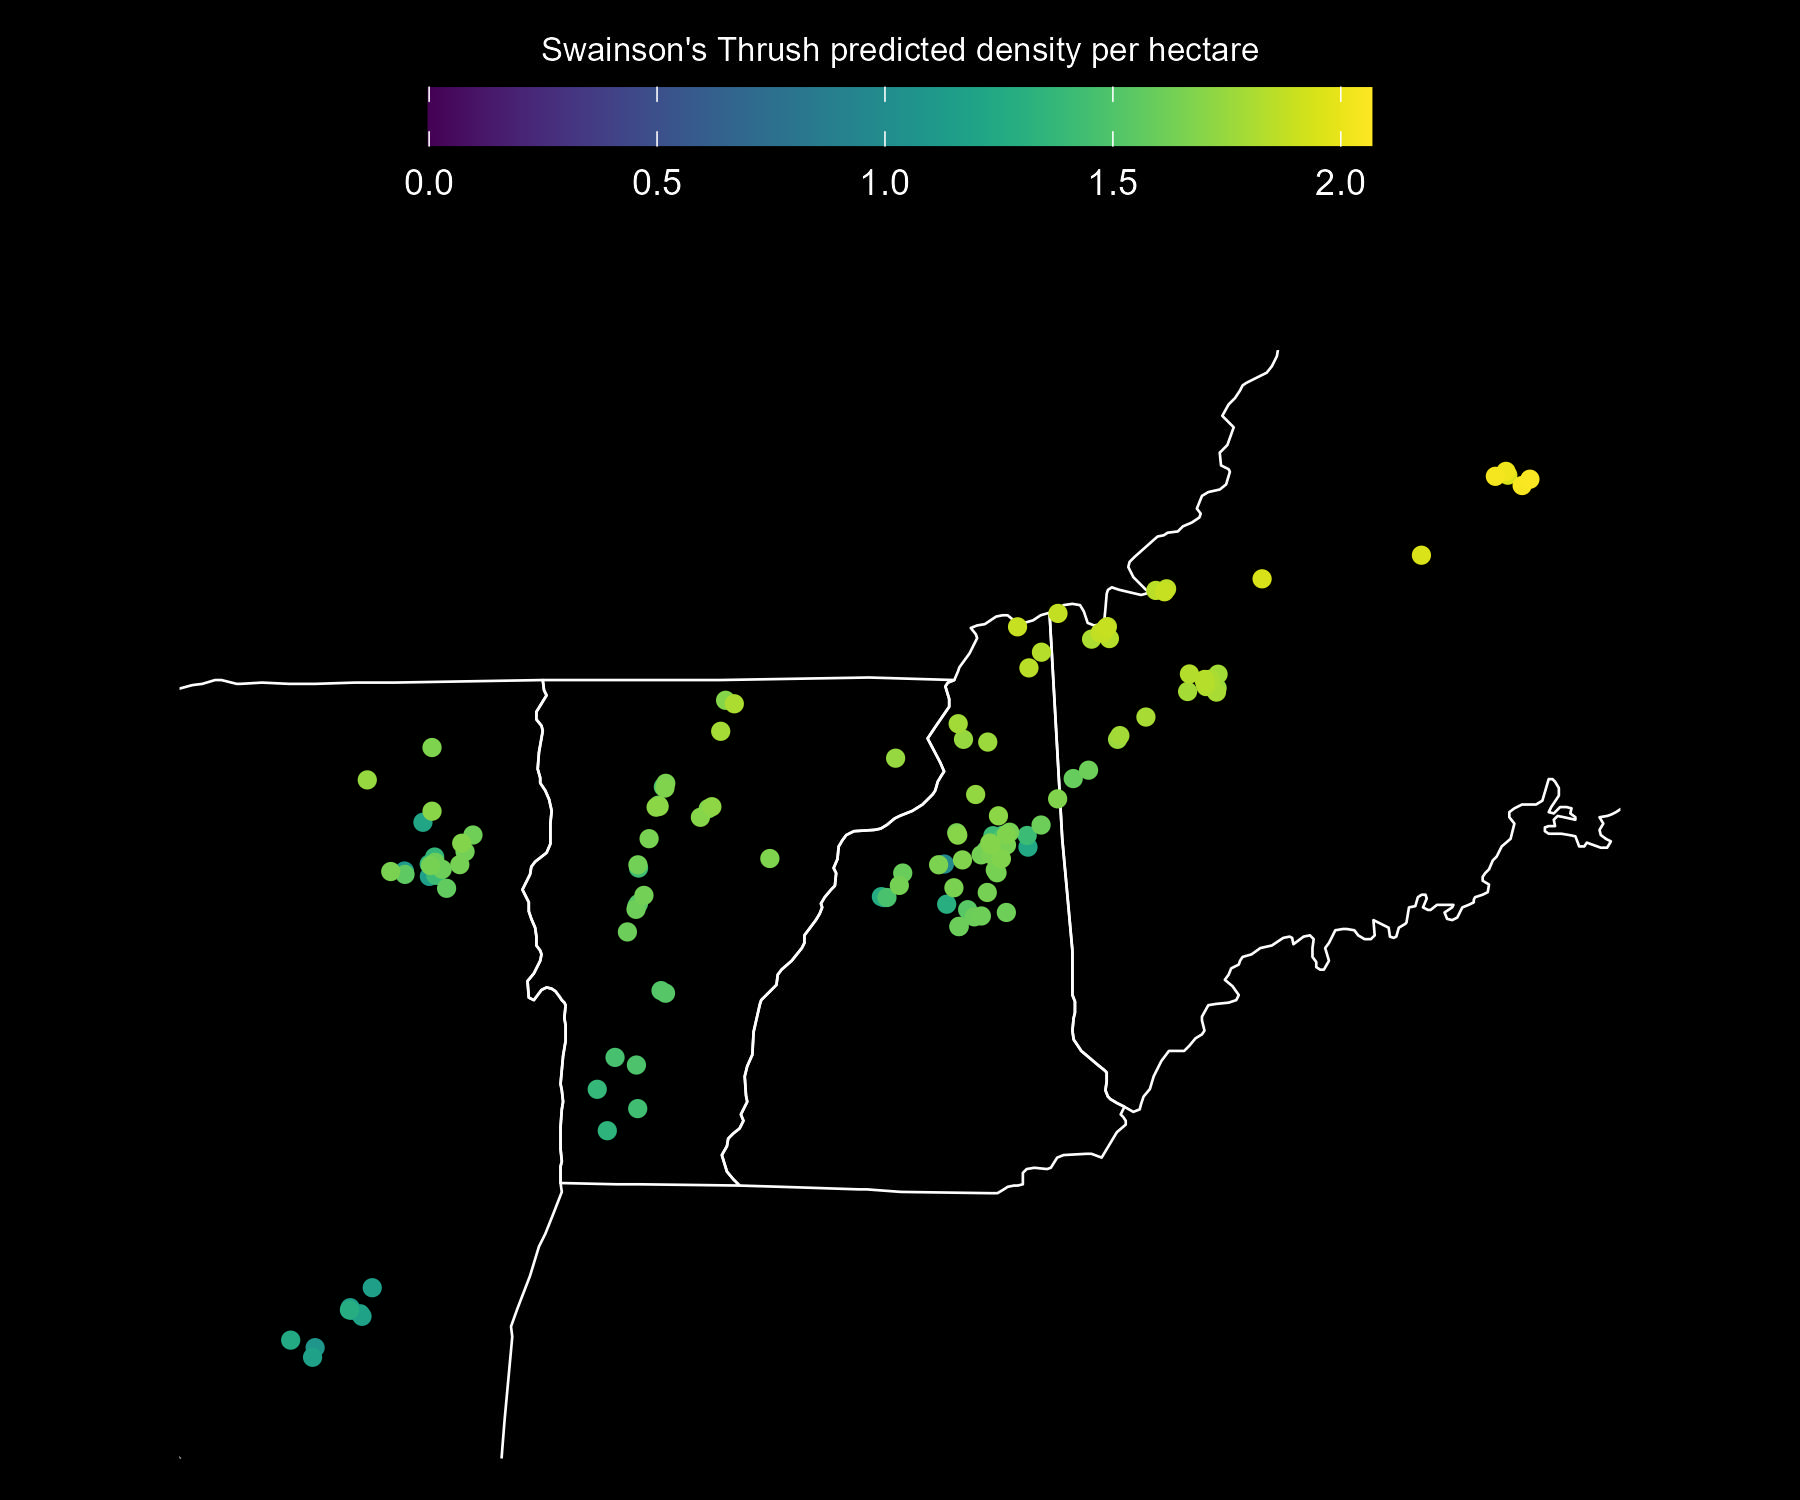
Predicted Swainson’s Thrush adult density per approximate hectare, as estimated from Mountain Birdwatch data. The base map shows the extent of the Mountain Birdwatch region: eastern New York, Vermont, New Hampshire, and western Maine.
Population trends for Swainson’s Thrush from 2010–2025 based on Mountain Birdwatch monitoring data. Values show the estimated mean annual population change (%) and the cumulative population change (%) since 2010, each with 95% Bayesian credible intervals (CRI). Colored dots indicate the direction and strength of evidence for a trend. Strong evidence occurs when the 95% CRI does not include zero. The probability of increase (0–1) reflects the proportion of model estimates indicating a positive population change.
| Region | Annual trend (%) | Trend (95% CRI) | Probability of increase | Population change (%) 2010-2025 | Population change (95% CRI) |
|---|---|---|---|---|---|
| All regions | ●-2.22 | (-2.58, -1.85) | <0.01 | -28.6 | (-32.5, -24.4) |
| Maine | ●-1.63 | (-2.36, -0.89) | <0.01 | -21.7 | (-30.1, -12.6) |
| New Hampshire | ●-2.09 | (-2.67, -1.51) | <0.01 | -27.1 | (-33.4, -20.4) |
| New York (Adirondacks) | ●-3.89 | (-4.81, -2.97) | <0.01 | -44.7 | (-52.3, -36.4) |
| New York (Catskills) | ●-1.59 | (-3.29, 0.10) | 0.03 | -20.7 | (-39.4, 1.5) |
| Vermont | ●-1.89 | (-2.73, -1.08) | <0.01 | -24.7 | (-33.9, -15.0) |
● strong decline
● weak decline
● weak increase
● strong increase
Globally: Declining
Trend estimates from the North American Breeding Bird Survey and eBird largely agree with each other and Mountain Birdwatch data. These data sources indicate modest, widespread declines in Swainson’s Thrush numbers throughout North America (~0.4% per year). These declines appear to have begun in the early 1980s, and are most severe across the northeastern U.S. and southeastern Canada. They have disappeared from many locales, such as coastal areas and major interior valleys, that they once inhabited in California. Counts of this species made at several migratory stopover sites (e.g., Long Point Bird Observatory) have declined as well. Areas where population trends are increasing for Swainson’s Thrush include the the British Columbia coastal forests and Alaska.