
The State of Winter Wrens in the Northeast United States
Declining
Population has overall decreased by 32% since 2010
Winter Wren population changes, with 95% credible intervals, as based on Mountain Birdwatch monitoring data within each region from 2010-2025.
 The numbers of Winter Wrens counted during Mountain Birdwatch surveys have been declining since at least 2012. Since 2010, the overall numbers of Winter Wren in our study area have changed by -2.50% per year. This equates to a 31.6% overall reduction in population size since 2010. In the both Mountain Birdwatch and the North American Breeding Bird Survey data sets, Winter Wren numbers fluctuate up and down frequently–these fluctuations may be related to severe winter mortality.
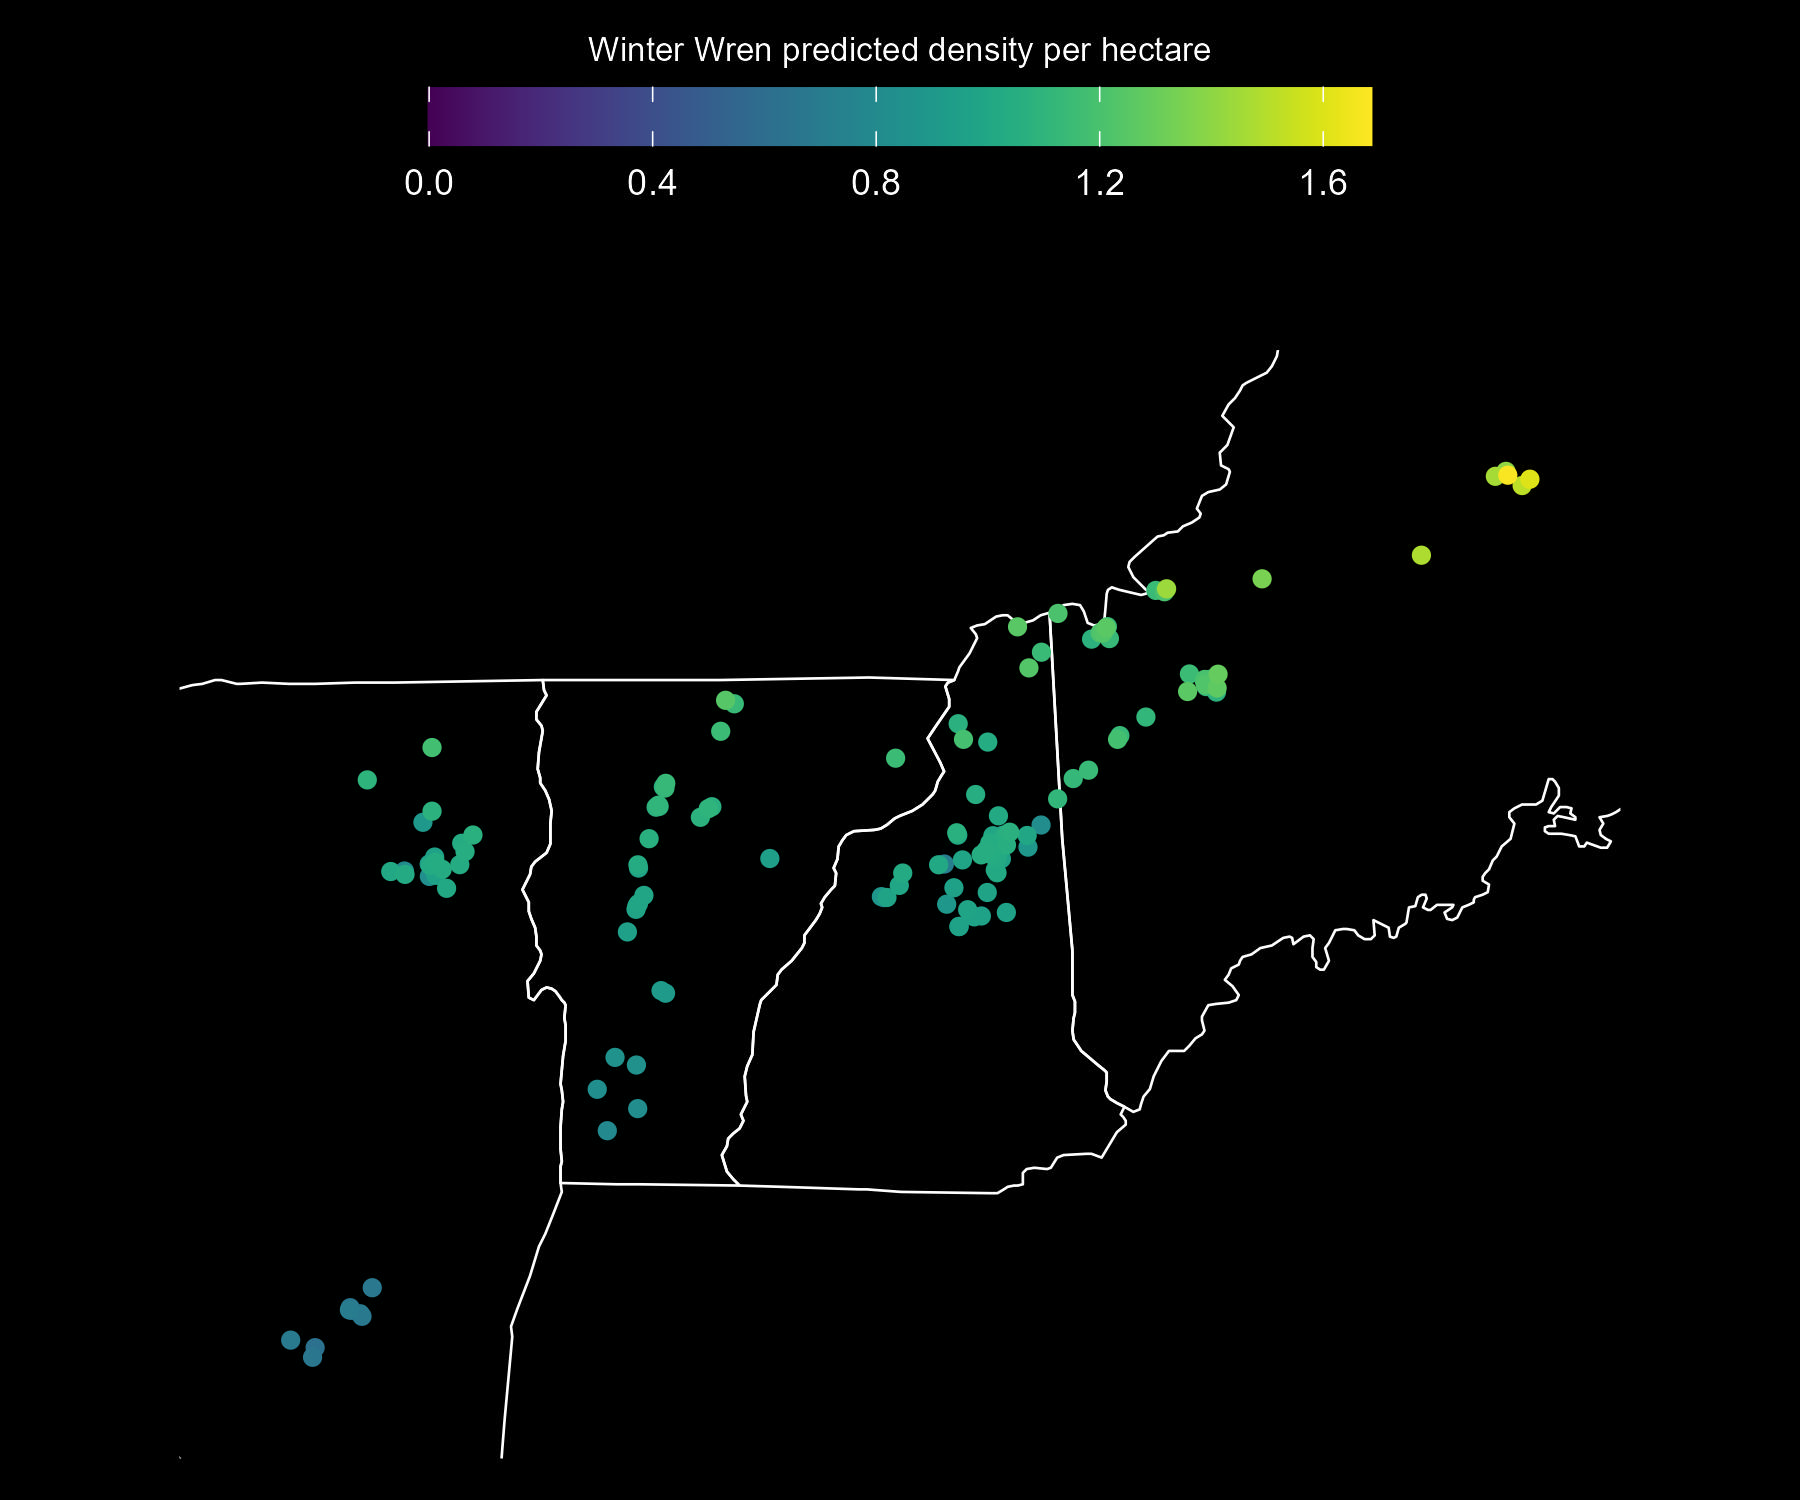
Predicted Winter Wren adult density per approximate hectare, as estimated from Mountain Birdwatch data. The base map shows the extent of the Mountain Birdwatch region: eastern New York, Vermont, New Hampshire, and western Maine.
Although in some respects a hardy bird, as evidenced by their ability to nest successfully on mountaintops in the Northeast or on the edge of the tundra in northern Canada, Winter Wrens are also quite sensitive to winter weather. Populations crash following severe winters in the southeastern United States, in some cases to the point of local extinction. This pattern is evident in the Mountain Birdwatch data: following the notably cold, snowy winter of 2013-2014, numbers of Winter Wren dropped dramatically.
Population trends for Winter Wren from 2010–2025 based on Mountain Birdwatch monitoring data. Values show the estimated mean annual population change (%) and the cumulative population change (%) since 2010, each with 95% Bayesian credible intervals (CRI). Colored dots indicate the direction and strength of evidence for a trend. Strong evidence occurs when the 95% CRI does not include zero. The probability of increase (0–1) reflects the proportion of model estimates indicating a positive population change.
| Region | Annual trend (%) | Trend (95% CRI) | Probability of increase | Population change (%) 2010-2025 | Population change (95% CRI) |
|---|---|---|---|---|---|
| All regions | ●-2.50 | (-2.96, -2.04) | <0.01 | -31.6 | (-36.3, -26.6) |
| Maine | ●-3.70 | (-4.70, -2.72) | <0.01 | -43.1 | (-51.5, -33.9) |
| New Hampshire | ●-2.57 | (-3.33, -1.80) | <0.01 | -32.3 | (-39.8, -23.9) |
| New York (Adirondacks) | ●-2.34 | (-3.43, -1.20) | <0.01 | -29.7 | (-40.8, -16.6) |
| New York (Catskills) | ●-3.36 | (-5.31, -1.49) | <0.01 | -39.5 | (-55.9, -20.1) |
| Vermont | ●-1.24 | (-2.14, -0.31) | <0.01 | -16.8 | (-27.7, -4.5) |
● strong decline
● weak decline
● weak increase
● strong increase
Globally: Slightly declining or stable
Data collected by the North American Breeding Bird Survey indicate that Winter Wren numbers across Canada and the U.S. have fluctuated substantially but show a slightly declining overall trend since the survey began in 1966. eBird trends show much more regional variation, but estimate that Winter Wrens have declined by as much as 10% to 40% over the last decade in New England and Eastern Canada.