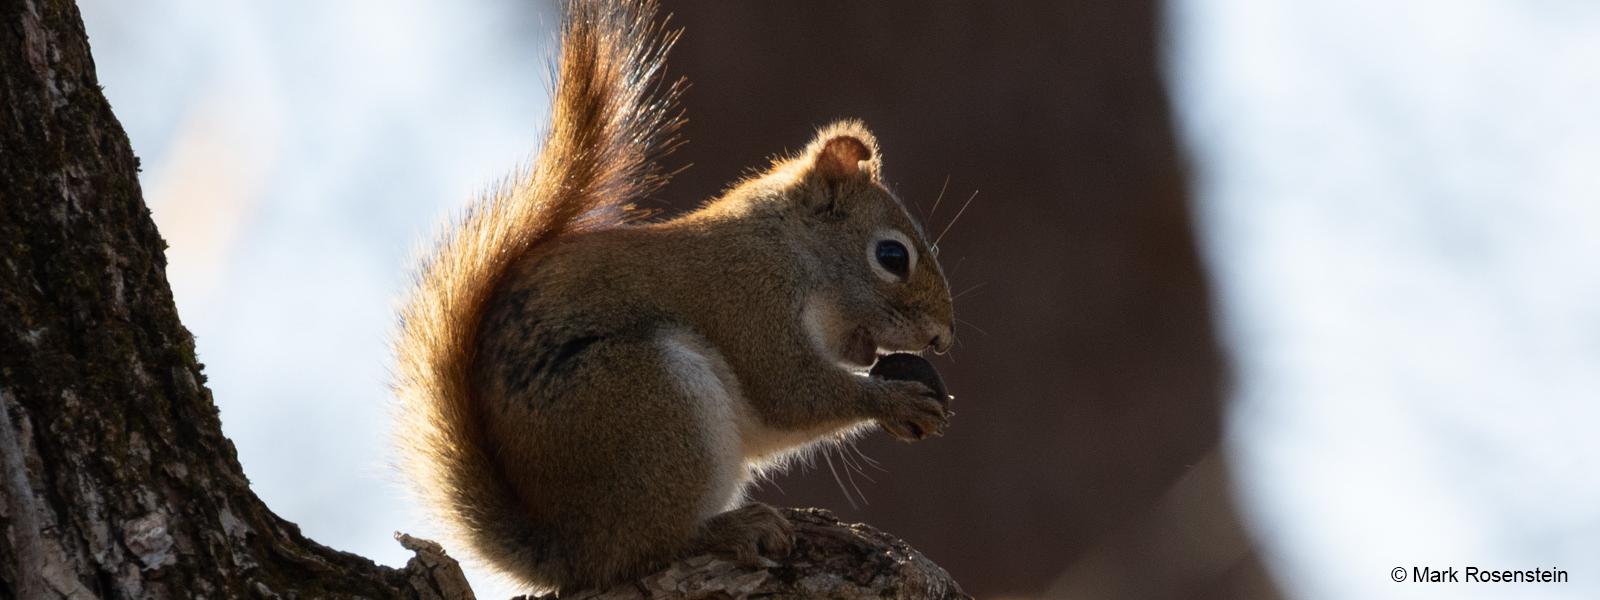
The State of Red Squirrels in the Northeast United States
Increasing
Population has overall more than tripled since 2010
Red Squirrel population changes, with 95% credible intervals, as based on Mountain Birdwatch monitoring data within each region from 2010-2025.
 Since 2010, Mountain Birdwatch protocol has involved recording the number of Red Squirrels at each sampling station with the aim of understanding how this common nest predator’s cyclical population dynamics interact with those of our monitored bird species. Mountain Birdwatch data show a mean annual trend of greater than 9% in the mountains of our region, but thinking of Red Squirrel populations as steadily changing from year to year isn’t a helpful way to describe their population dynamics. The figure above shows a much more complex pattern than a single number can convey. VCE ecologists Mike Hallworth, Kent McFarland, Chris Rimmer (retired) and Jason Hill published an open-access paper in Diversity and Distributions describing the population dynamics of Red Squirrel. The conifers on which Red Squirrels feed produce seeds in approximately 3-5 year cycles causing the population to fluctuate significantly from year to year. Red Squirrels can persist in the spruce-fir zone only during winters with substantial amounts of food: namely, mature Balsam Fir (Abies balsamea) and Spruce (Picea species) cones [which mature in the autumn]. In autumns with abundant cones, Red Squirrels are able to move upslope from the hardwood-spruce-fir ecotone, and collect and store these cones in piles (called middens). The collective size of a squirrel’s middens is directly related to their overwinter survival. Following winters with abundant spruce and fir cones, red squirrels remain at those high elevations through the next autumn. During those summers with squirrels at high elevations, squirrels exhibit a substantial effect on the nest survival patterns of spruce-fir birds. In winters without abundant cones, Red Squirrels remain at relatively lower elevations, especially along the hardwood-spruce-fir transition zone.
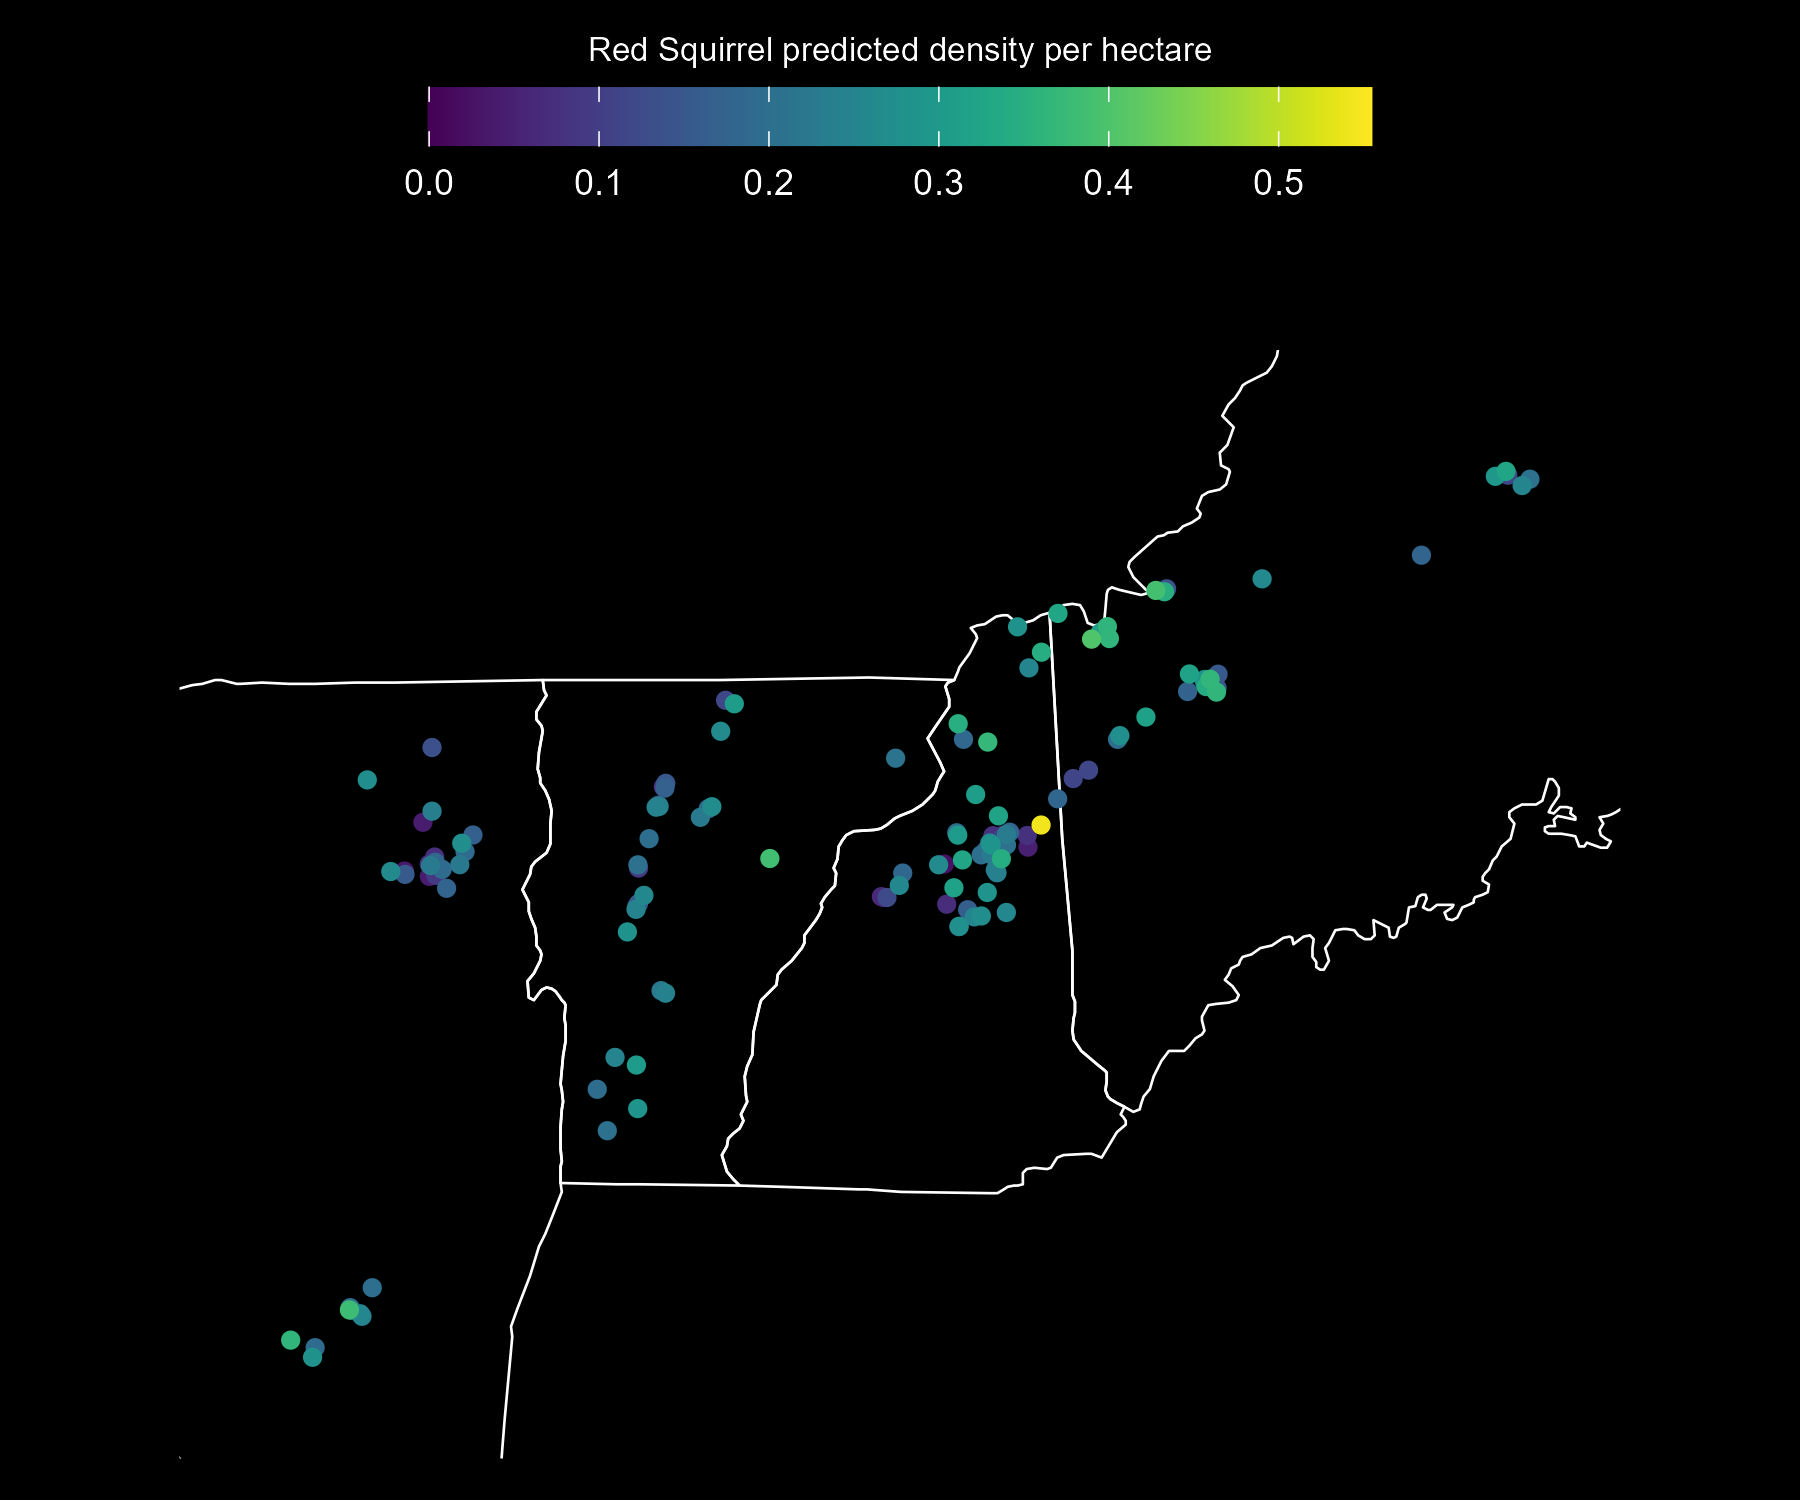
Predicted Red Squirrel adult density per approximate hectare, as estimated from Mountain Birdwatch data. The base map shows the extent of the Mountain Birdwatch region: eastern New York, Vermont, New Hampshire, and western Maine.
Population trends for Red Squirrel from 2010–2025 based on Mountain Birdwatch monitoring data. Values show the estimated mean annual population change (%) and the cumulative population change (%) since 2010, each with 95% Bayesian credible intervals (CRI). Colored dots indicate the direction and strength of evidence for a trend. Strong evidence occurs when the 95% CRI does not include zero. The probability of increase (0–1) reflects the proportion of model estimates indicating a positive population change.
| Region | Annual trend (%) | Trend (95% CRI) | Probability of increase | Population change (%) 2010-2025 | Population change (95% CRI) |
|---|---|---|---|---|---|
| All regions | ●9.24 | (8.28, 10.24) | >0.99 | 277.4 | (229.6, 331.4) |
| Maine | ●12.56 | (10.75, 14.46) | >0.99 | 494.5 | (362.4, 658.6) |
| New Hampshire | ●8.83 | (7.32, 10.43) | >0.99 | 258.0 | (188.4, 342.7) |
| New York (Adirondacks) | ●9.94 | (7.17, 12.78) | >0.99 | 321.8 | (182.4, 507.5) |
| New York (Catskills) | ●2.73 | (-0.83, 6.19) | 0.94 | 54.7 | (-11.8, 146.3) |
| Vermont | ●7.38 | (5.46, 9.31) | >0.99 | 193.5 | (122.0, 280.2) |
● strong decline
● weak decline
● weak increase
● strong increase
For more information see: Hallworth, M.T., A.P.K. Sirén,, W.V. DeLuca, T.R. Duclos, K.P. McFarland, J.M. Hill, C.C. Rimmer, and T.L. Morelli. 2024. Boom and bust: the effects of masting on seed predator range dynamics and trophic cascades. Diversity and Distributions 30: e13861. https://onlinelibrary.wiley.com/doi/10.1111/ddi.13861?af=R