The State of Hermit Thrushes in the Northeast United States
Rapidly declining
Population has overall decreased by 63% since 2010
Hermit Thrush population changes, with 95% credible intervals, as based on Mountain Birdwatch monitoring data within each region from 2010-2025.
 Hermit Thrush are relatively uncommon in the montane forests surveyed as part of Mountain Birdwatch. By comparison, a visitor to the spruce-fir zone is likely to encounter approximately twice as many Bicknell’s Thrush as Hermit Thrush for the time being. The estimated local abundance of Hermit Thrush around Mountain Birdwatch sampling stations paint an interesting picture. Numbers of Hermit Thrush were clearly on the rise from 2010 to 2014, but then the population suddenly and unexpectedly declined where it has overall declined since 2015.
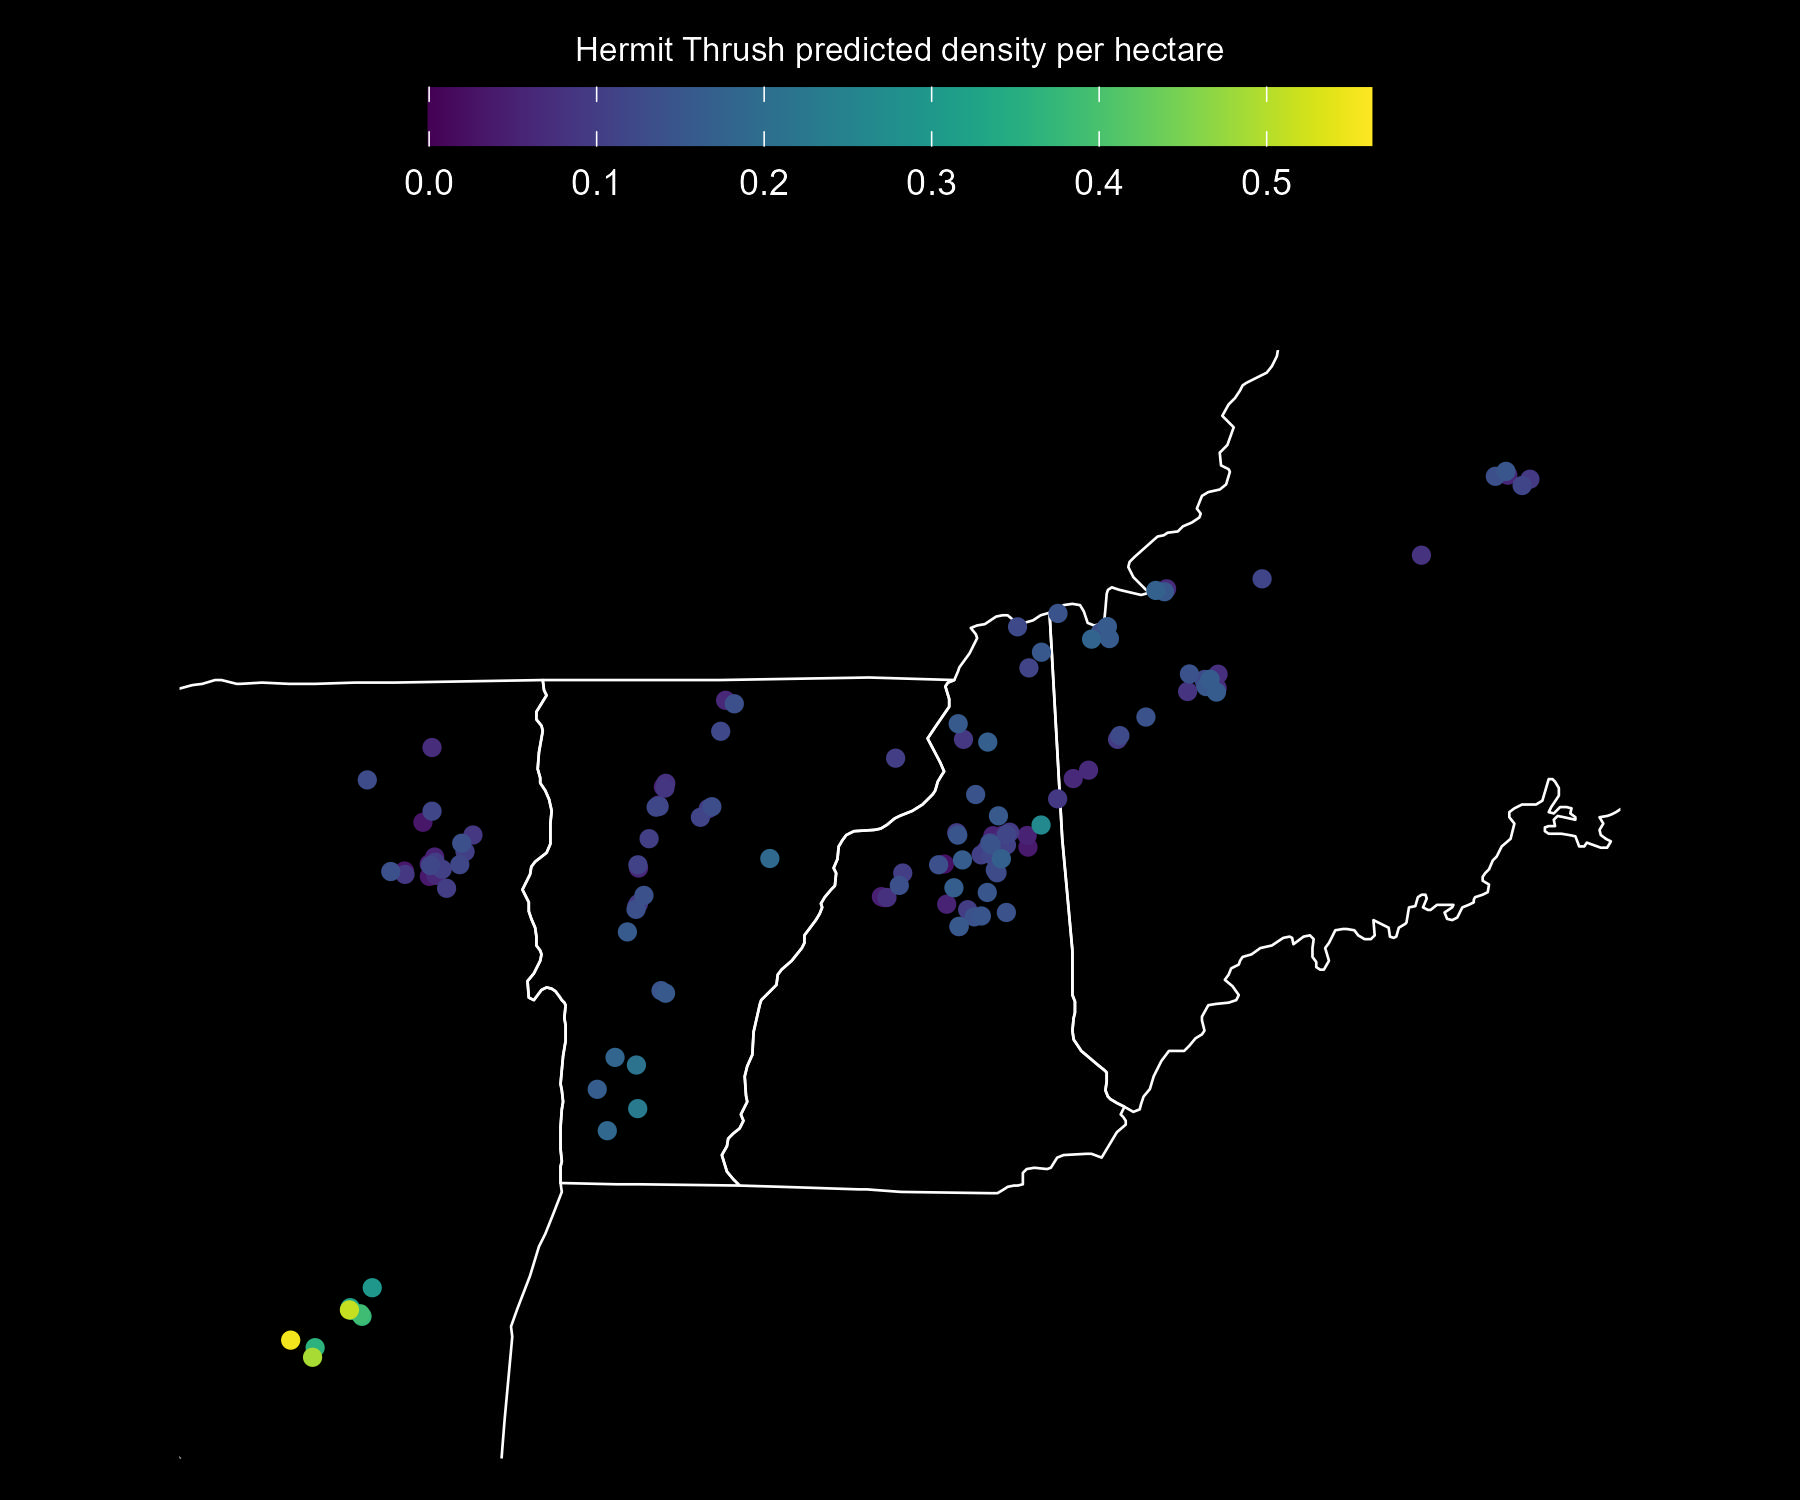
Predicted Hermit Thrush adult density per approximate hectare, as estimated from Mountain Birdwatch data. The base map shows the extent of the Mountain Birdwatch region: eastern New York, Vermont, New Hampshire, and western Maine.
Population trends for Hermit Thrush from 2010–2025 based on Mountain Birdwatch monitoring data. Values show the estimated mean annual population change (%) and the cumulative population change (%) since 2010, each with 95% Bayesian credible intervals (CRI). Colored dots indicate the direction and strength of evidence for a trend. Strong evidence occurs when the 95% CRI does not include zero. The probability of increase (0–1) reflects the proportion of model estimates indicating a positive population change.
| Region | Annual trend (%) | Trend (95% CRI) | Probability of increase | Population change (%) 2010-2025 | Population change (95% CRI) |
|---|---|---|---|---|---|
| All regions | ●-6.38 | (-7.39, -5.31) | <0.01 | -62.7 | (-68.4, -55.9) |
| Maine | ●-8.39 | (-10.85, -5.91) | <0.01 | -72.6 | (-82.1, -59.9) |
| New Hampshire | ●-4.83 | (-6.81, -2.87) | <0.01 | -51.9 | (-65.3, -35.4) |
| New York (Adirondacks) | ●-4.12 | (-6.54, -1.68) | <0.01 | -45.8 | (-63.7, -22.5) |
| New York (Catskills) | ●-5.18 | (-7.81, -2.50) | <0.01 | -54.0 | (-70.5, -31.6) |
| Vermont | ●-8.89 | (-10.68, -7.10) | <0.01 | -75.0 | (-81.6, -66.8) |
● strong decline
● weak decline
● weak increase
● strong increase
Globally: Declining
Mountain Birdwatch data suggest that Hermit Thrush populations have undergone tremendous declines over the past 15 year, with Vermont’s population of Hermit Thrush (within the spruce-fir zone) having declined by >77%. At the same time, it’s important to keep in mind that the majority of Hermit Thrush breed at lower elevations, in the hardwood forest. The range of the Hermit Thrush has only recently expanded to include the northeastern U.S. They first expanded into southern New England in the early 1990s (possibly associated with farm abandonment and reforestation), and quickly expanded northward. So while these steep declines for much of the spruce-fir zone are alarming, and parallel state-specific trends from the North American Breeding Bird survey (BBS), they may not tell the full story. eBird trends, however, suggest that Hermit Thrush populations have declined over the last decade from across their entire breeding range, with the exception of Nova Scotia. The driving force behind these continental downward trends for Hermit Thrush is unknown at the moment. Hermit Thrush reach the upper limits of their elevational distribution in the lower zone of montane spruce-fir forests. Recent climate modeling suggests that Hermit Thrush will disappear from New England over the next 100 years.
Data collected by the Breeding Bird Survey indicate that the size of the breeding population of Hermit Thrushes has remained stable. Population gains appear concentrated in eastern North America, exemplified by the ongoing colonization of the southern Appalachians. However, populations in western North America, the Mid-Atlantic and New England states, are likely declining.