The State of Yellow-bellied Flycatchers in the Northeast United States
Declining
Population has overall decreased by 14% since 2010
Yellow-bellied Flycatcher population changes, with 95% credible intervals, as based on Mountain Birdwatch monitoring data within each region from 2010-2025.
 Yellow-bellied Flycatcher was not one of the original Mountain Birdwatch species monitored between 2000 and 2010, but so little is known about this species that we felt compelled to contribute to the scientific knowledge of the Moss Tyrant. Yellow-bellied Flycatcher populations in our region appear to have declined in recent years across the Mountain Birdwatch region (mean annual regional trend = -1.02%, 95% Bayesian credible interval = -1.65% to -0.37%). Declines are the most substantial in the Catskills of New York where this species has gone from uncommon (46 individuals detected in 2011) to rare (fewer than 10 in recent years).
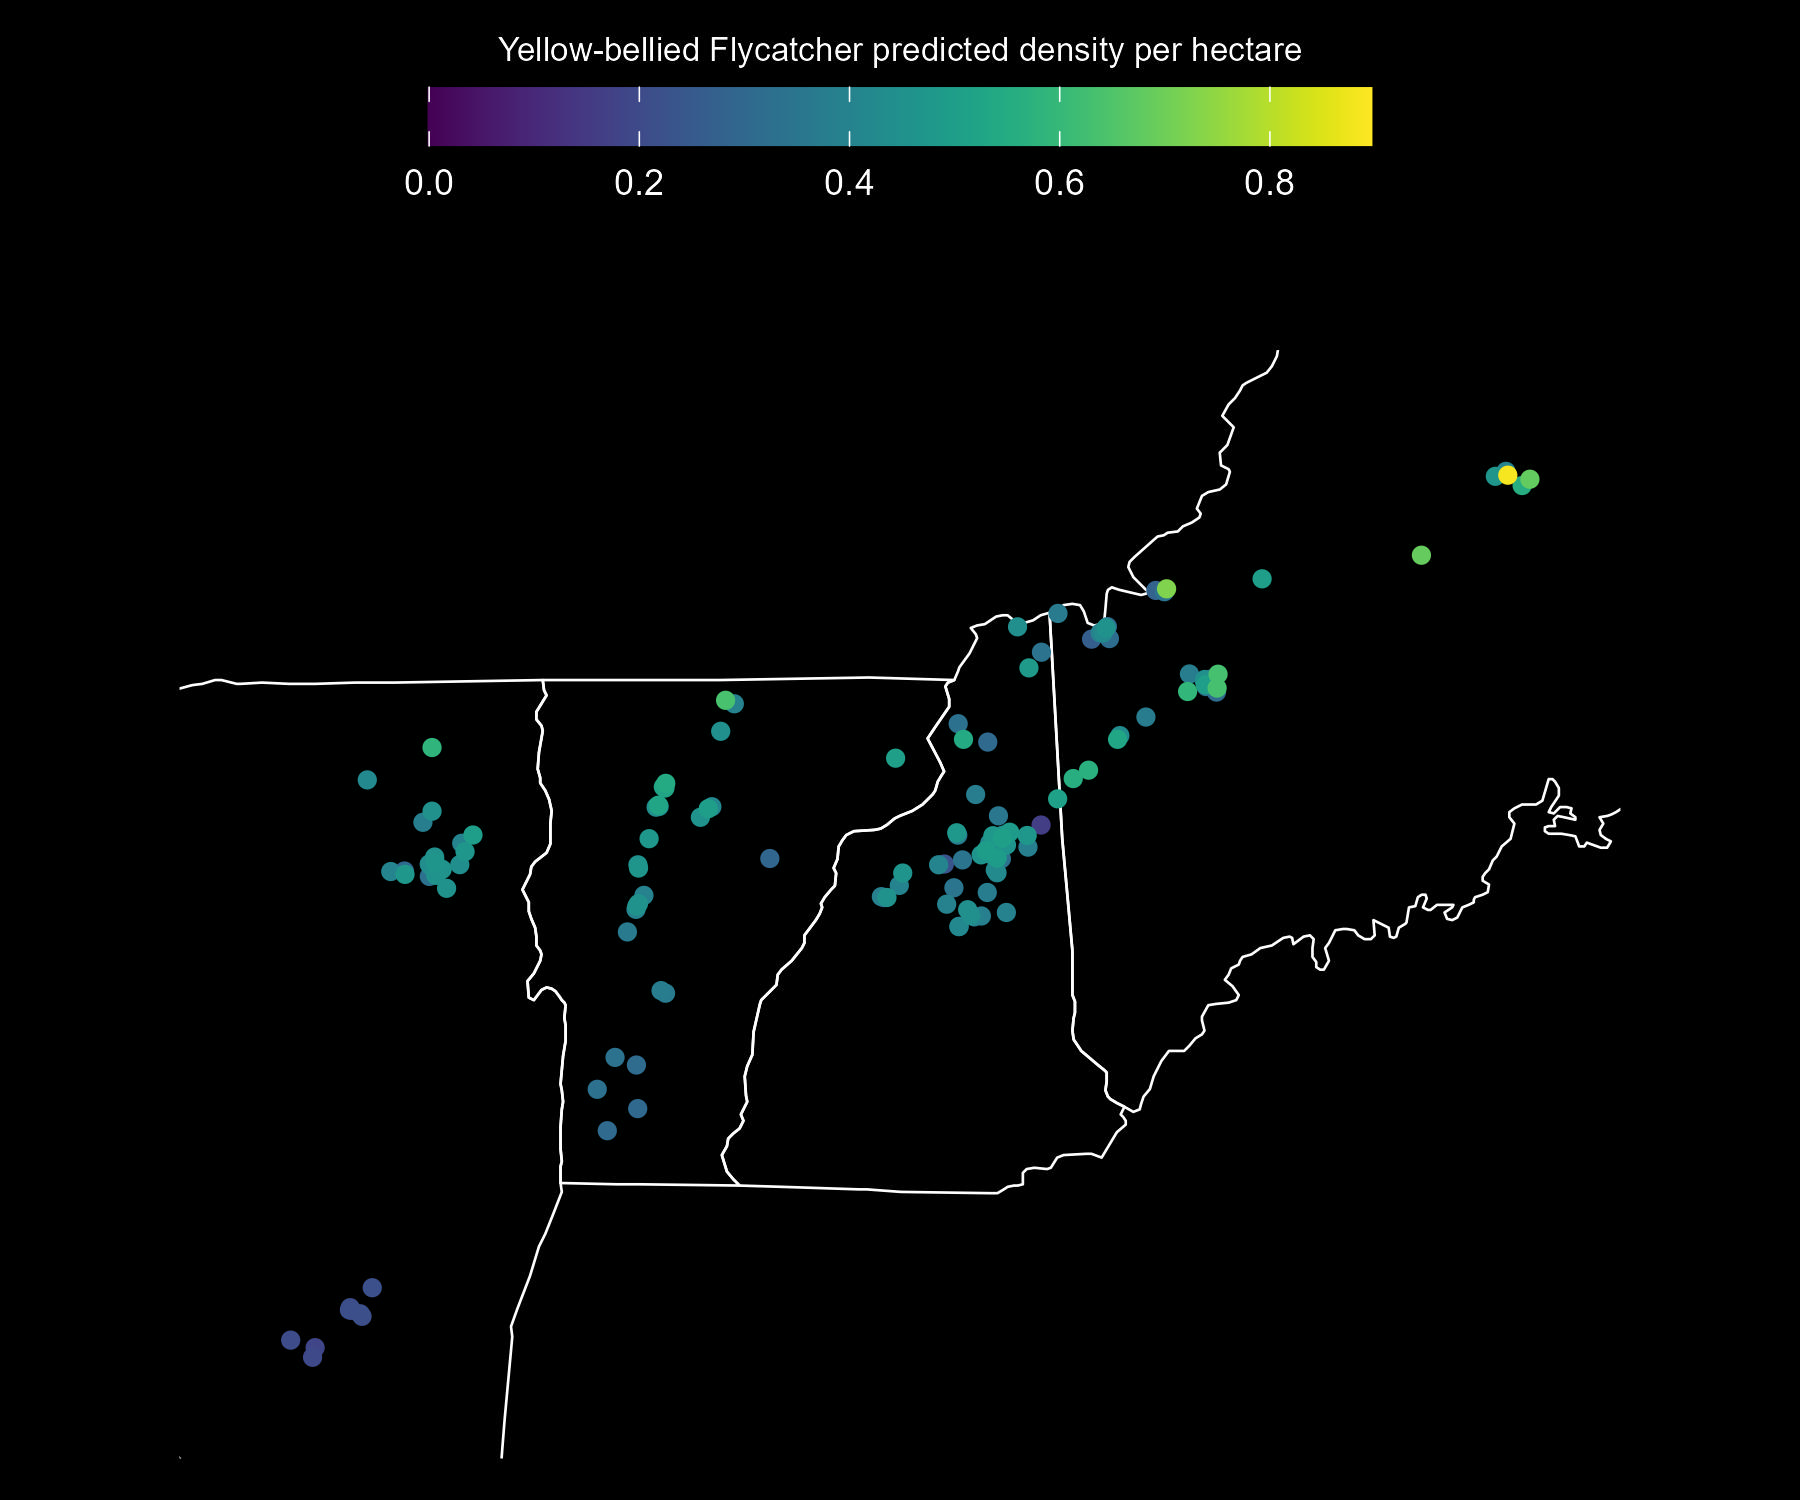
Predicted Yellow-bellied Flycatcher adult density per approximate hectare, as estimated from Mountain Birdwatch data. The base map shows the extent of the Mountain Birdwatch region: eastern New York, Vermont, New Hampshire, and western Maine.
Population trends for Yellow-bellied Flycatcher from 2010–2025 based on Mountain Birdwatch monitoring data. Values show the estimated mean annual population change (%) and the cumulative population change (%) since 2010, each with 95% Bayesian credible intervals (CRI). Colored dots indicate the direction and strength of evidence for a trend. Strong evidence occurs when the 95% CRI does not include zero. The probability of increase (0–1) reflects the proportion of model estimates indicating a positive population change.
| Region | Annual trend (%) | Trend (95% CRI) | Probability of increase | Population change (%) 2010-2025 | Population change (95% CRI) |
|---|---|---|---|---|---|
| All regions | ●-1.02 | (-1.65, -0.37) | <0.01 | -14.1 | (-22.1, -5.4) |
| Maine | ●0.17 | (-1.27, 1.56) | 0.59 | 3.1 | (-17.4, 26.1) |
| New Hampshire | ●-0.09 | (-1.10, 0.95) | 0.43 | -1.0 | (-15.2, 15.2) |
| New York (Adirondacks) | ●-1.33 | (-2.71, 0.12) | 0.04 | -17.7 | (-33.7, 1.7) |
| New York (Catskills) | ●-8.11 | (-11.14, -5.08) | <0.01 | -71.0 | (-83.0, -54.2) |
| Vermont | ●-2.25 | (-3.73, -0.80) | <0.01 | -28.5 | (-43.4, -11.4) |
● strong decline
● weak decline
● weak increase
● strong increase
Globally: Increasing
The vast majority (>95%) of Yellow-bellied Flycatchers breed in Canada where this species is increasing in numbers, particularly in the northern and western part of their range. The discovery of new breeding populations recently in eastern Alaska also suggests a global population growing northward. Yellow-bellied Flycatchers are rarely detected during USGS Breeding Bird Surveys in the northeastern U.S., and eBird trends are only available for the nonbreeding season where they appear to be becoming more common. This nonbreeding season increase may be driven by the increasing number of Yellow-bellied Flycatchers coming from the northwestern portion of this species’ range.